
How-To Guide - Admins
How to review a journey automation as an admin
Open a live lead-nurture journey, read its branching send/wait/branch flow, inspect what each step actually sends, and check who's still moving through it.
Updated August 7, 2026
Overview
Use this guide to read a journey automation the way you'd review any live campaign: open its flow graph, inspect what a couple of its steps actually do, then check delivery stats and where each contact ended up. This walkthrough uses a real journey already running in the account — "Lead nurture drip" — so every screen here is live data, not a mockup.
Before you start
- At least one journey campaign exists in your account (JOURNEY kind, not a one-off broadcast).
Why this matters
A journey is a multi-step automation built from typed nodes — entry, send email, wait, wait-until, branch, and exit — connected by edges. Unlike a one-off broadcast, a journey can wait for a contact to click a link, branch their path based on whether they did, and route them to a different follow-up email depending on what happened. Once a journey has been launched, its content is frozen — you can look, but not edit — so the flow graph you see here is exactly what's been sending.
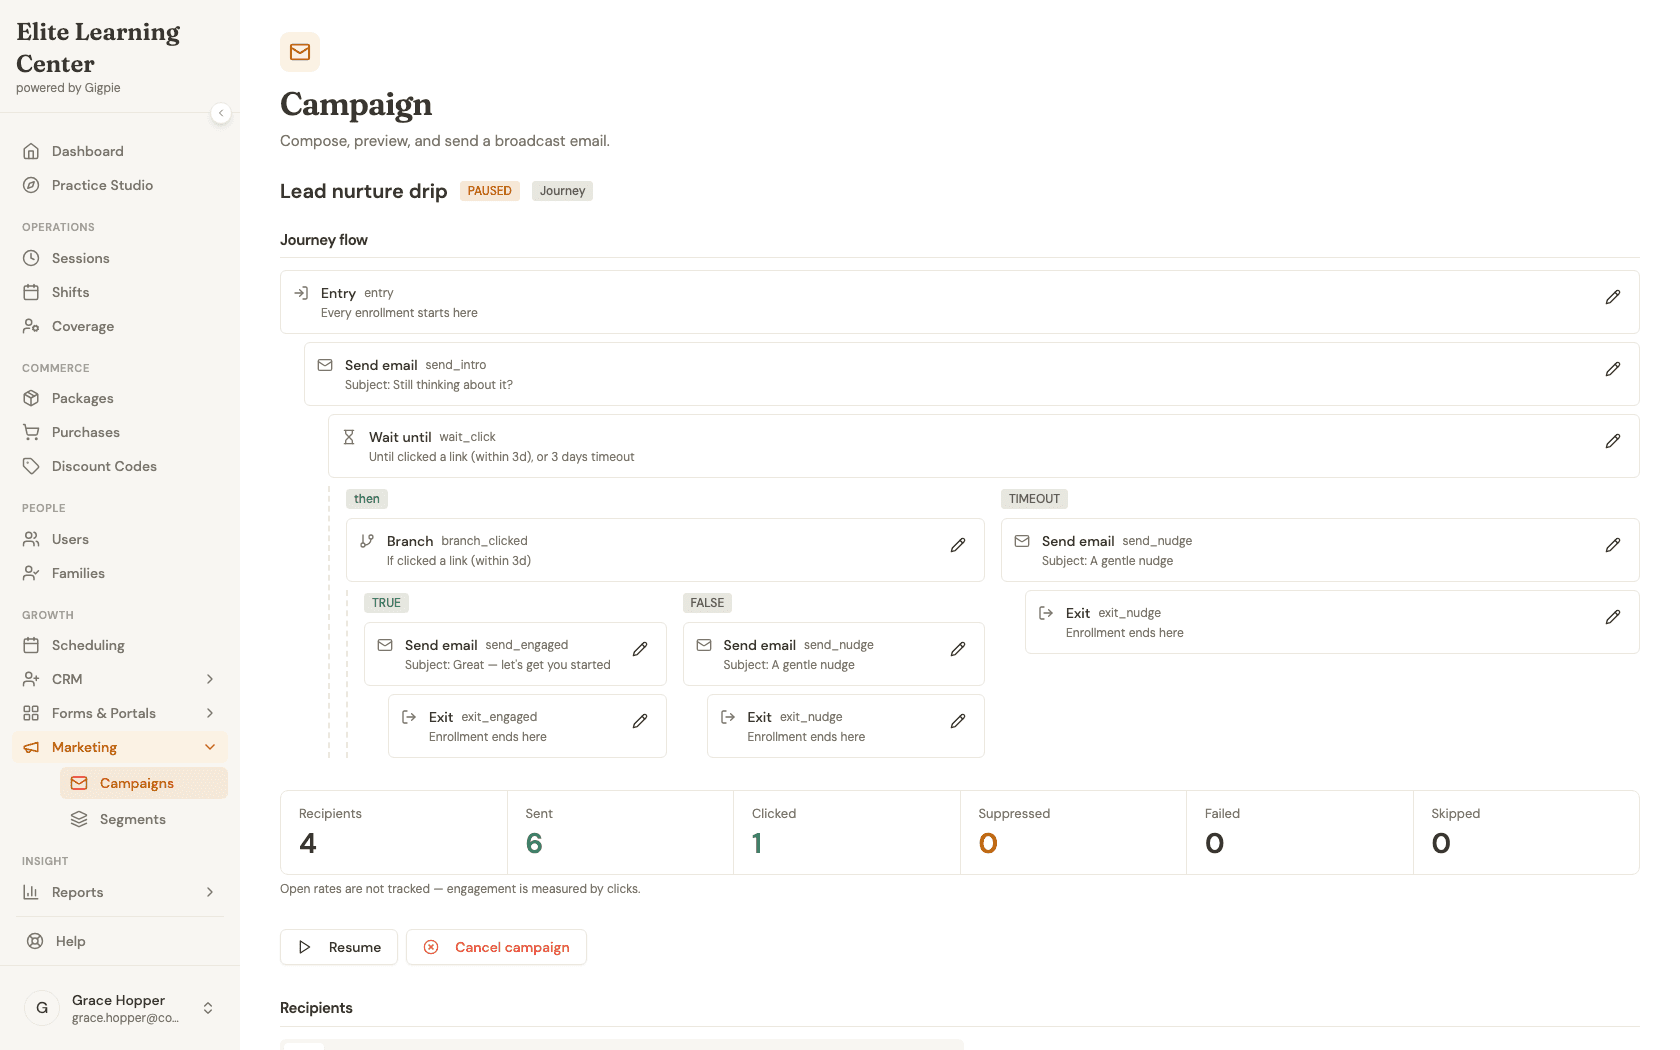
The "Lead nurture drip" journey in this account does exactly that: it sends an intro email, waits up to three days for a click, then branches — contacts who clicked get an "engaged" follow-up, contacts who didn't (or who timed out waiting) get a gentler nudge instead. Every enrollment that has gone through it has now finished, which is why the campaign shows as PAUSED rather than ACTIVE below — a journey with no active senders isn't broken, it's just between cohorts. Everything about reading the graph, inspecting a node, and checking stats works identically whether a journey is currently sending or sitting paused between runs.
Tips
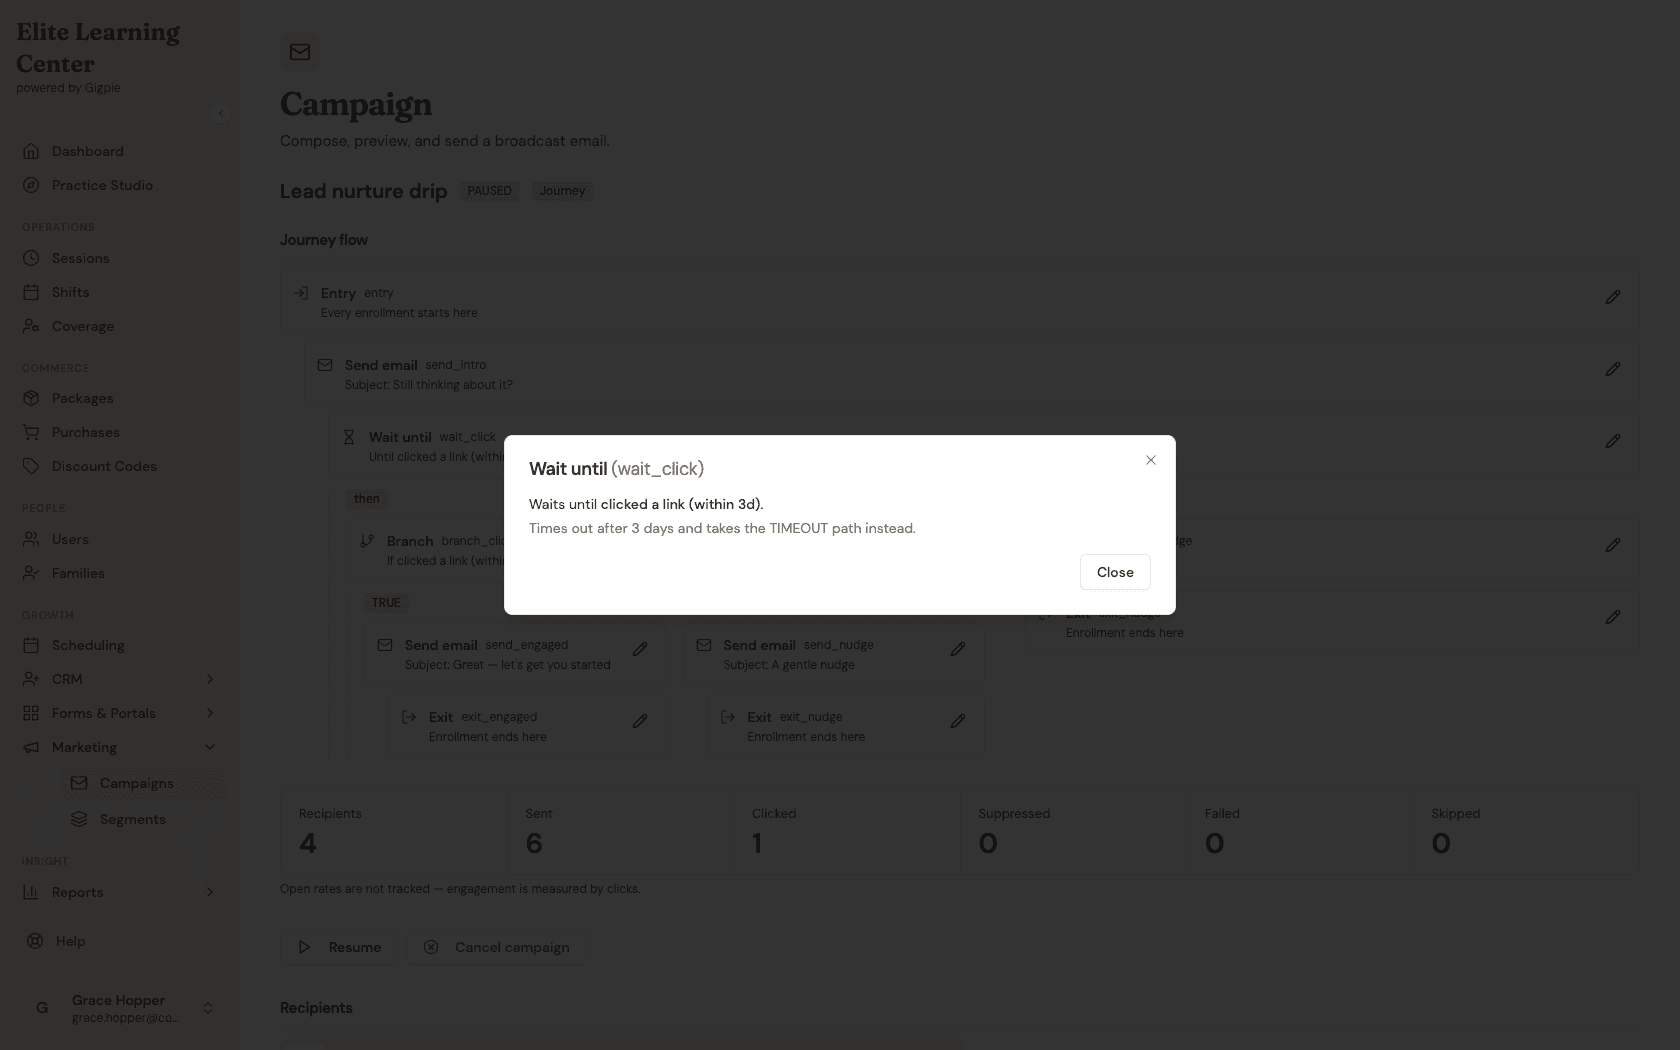
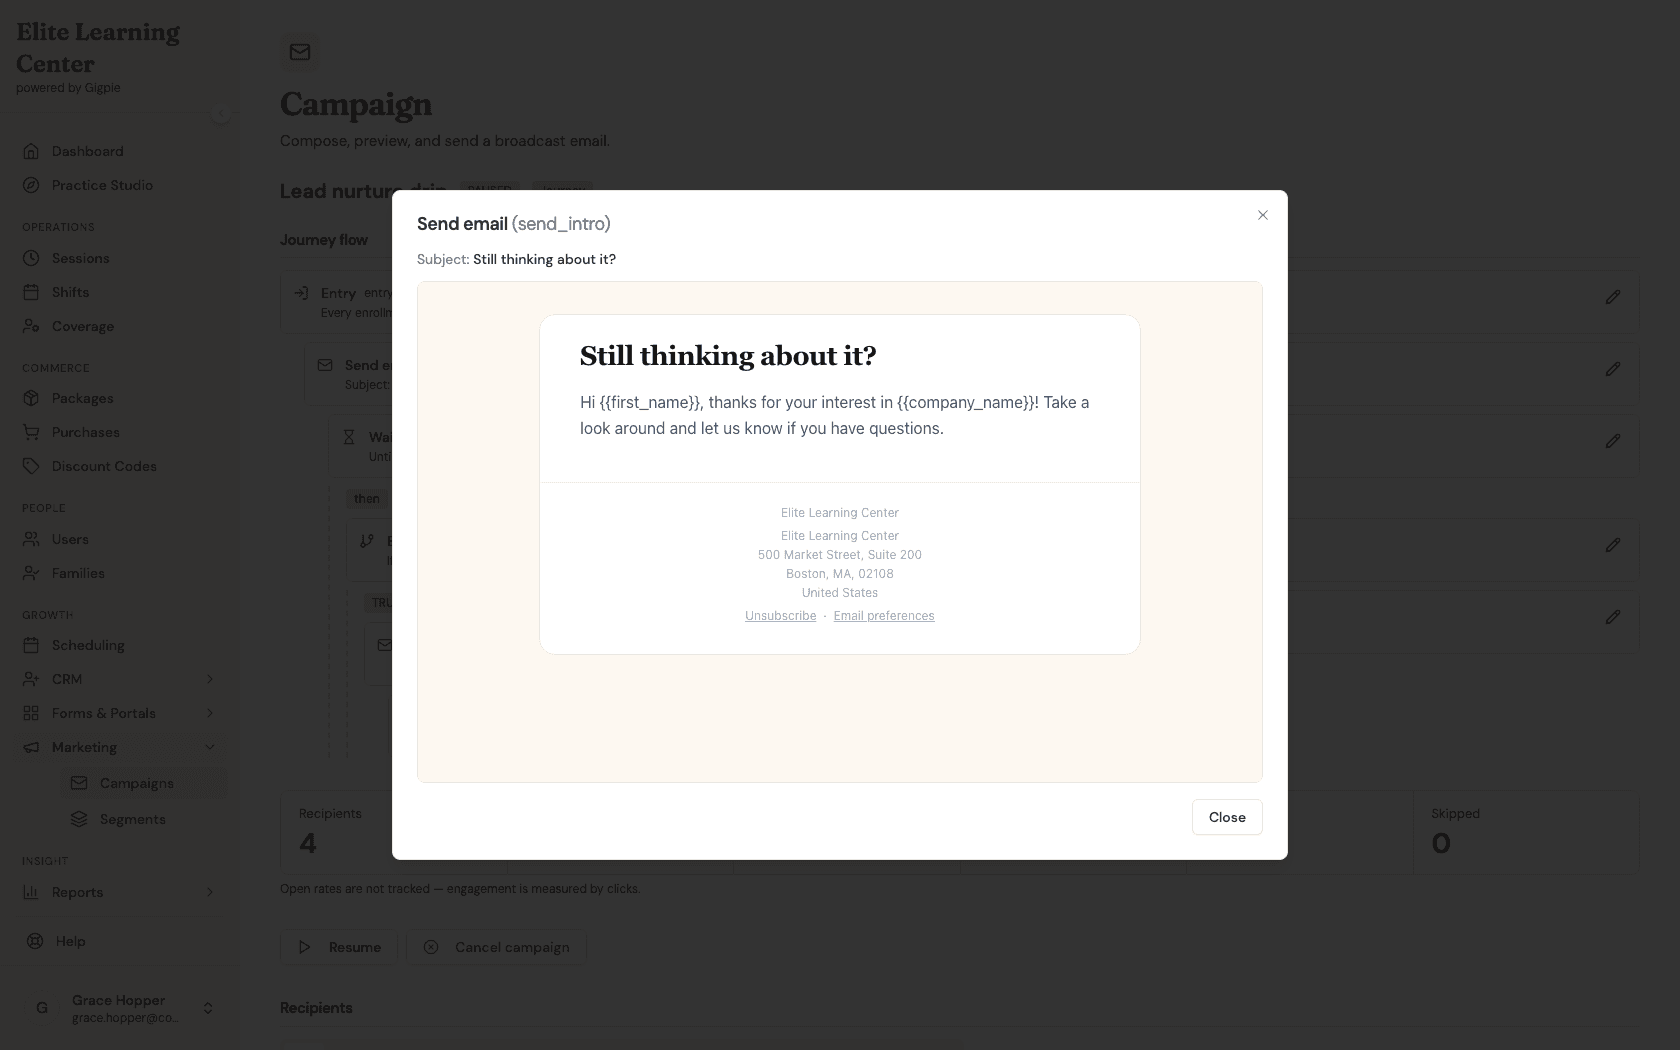
- Click any node card to open its inspector — control nodes (Wait until, Branch) show you the exact predicate and timeout in plain English; Send email nodes show the actual rendered email, subject line included.
- A node that currently has contacts parked on it shows a small "N waiting" badge right on its card — a fast way to spot where a journey's current cohort is stuck.
- The TRUE/FALSE and DEFAULT/TIMEOUT arms under a Branch or Wait until node are color-coded — green for the "went as hoped" path, neutral for the fallback.
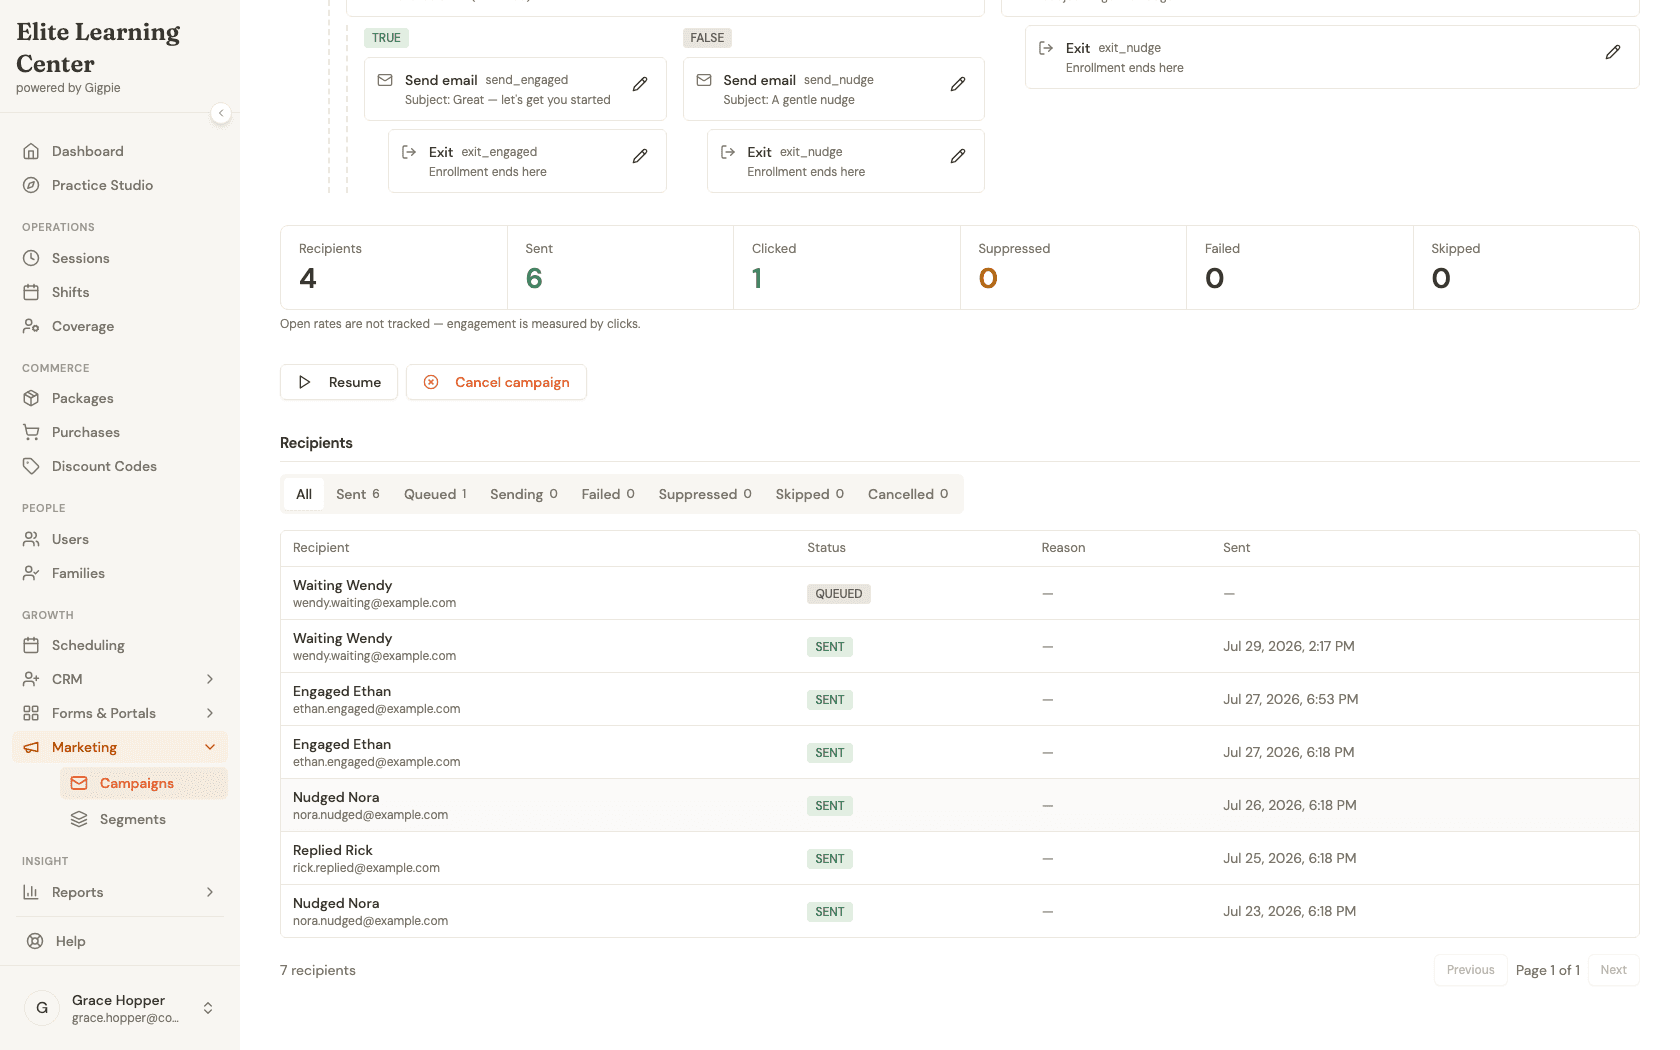
- The Recipients table at the bottom is per-send, not per-contact — a contact who received two emails (say, the intro and then the nudge) shows up as two rows, one per send.
- Scroll the recipients list to see individual outcomes: who's still active, who completed, and who exited early (for example, because they replied and the journey's stop-on-reply rule caught it before the next send).
Steps
- 1Go to login
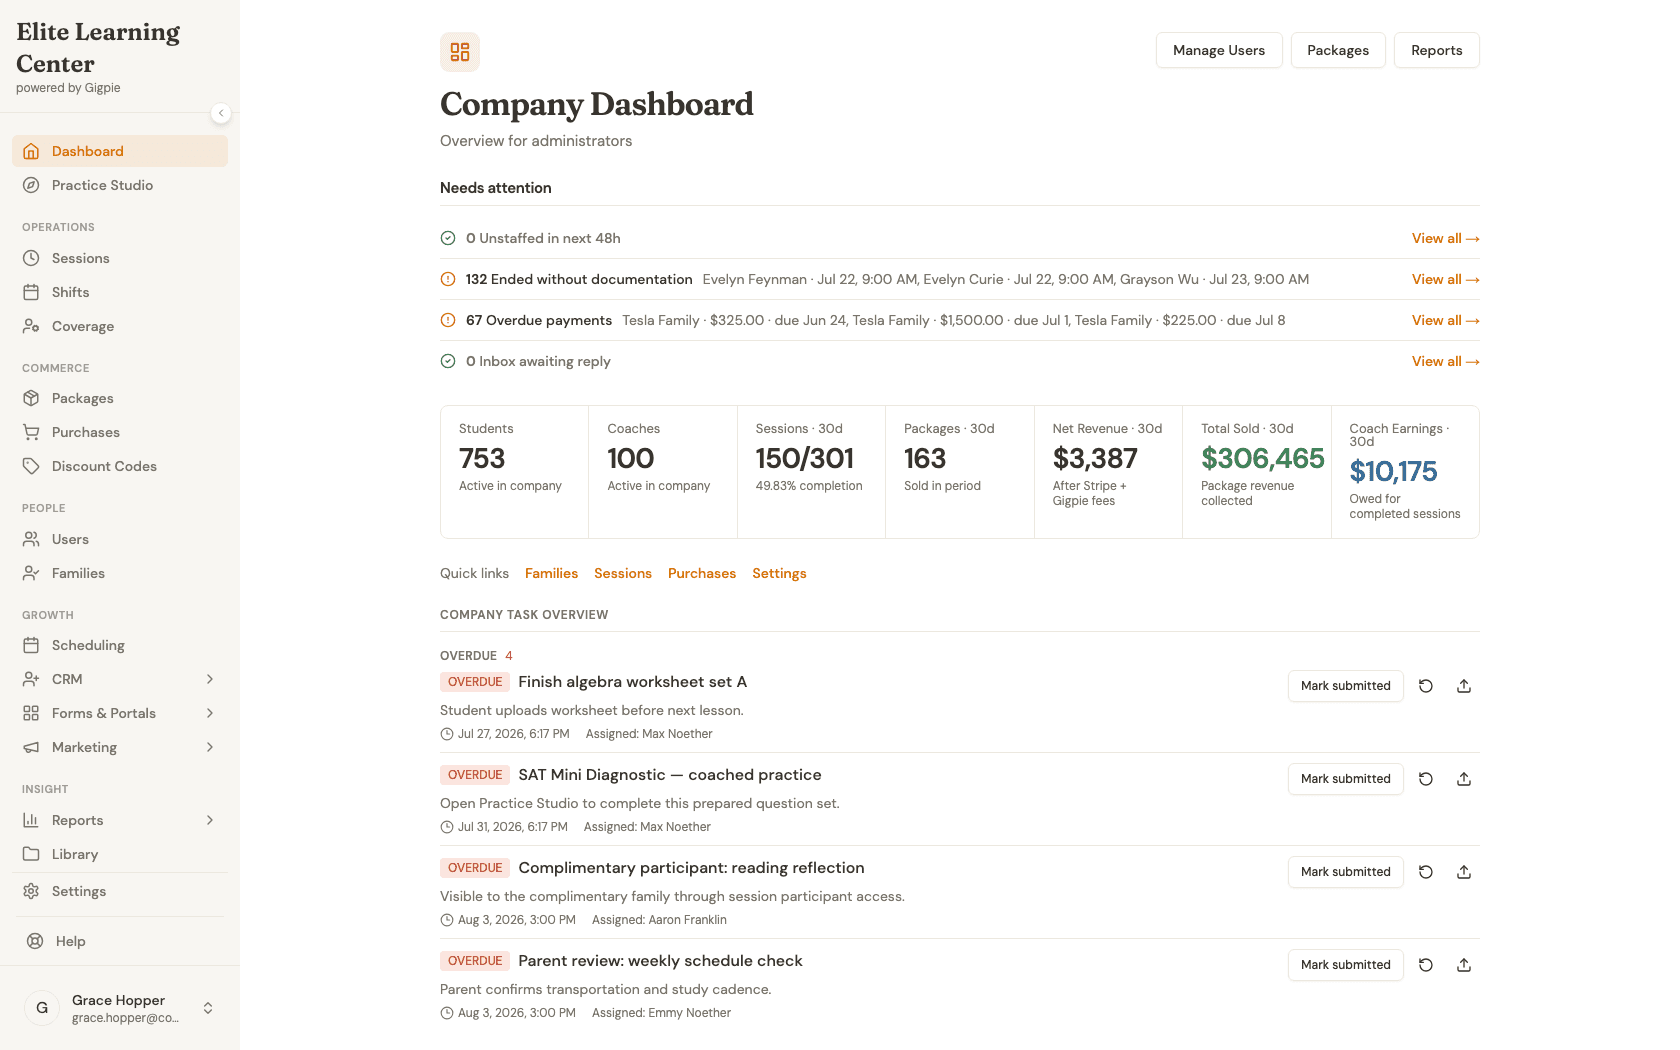
Sign in as an admin
Use your admin account credentials to access the dashboard.
- 2
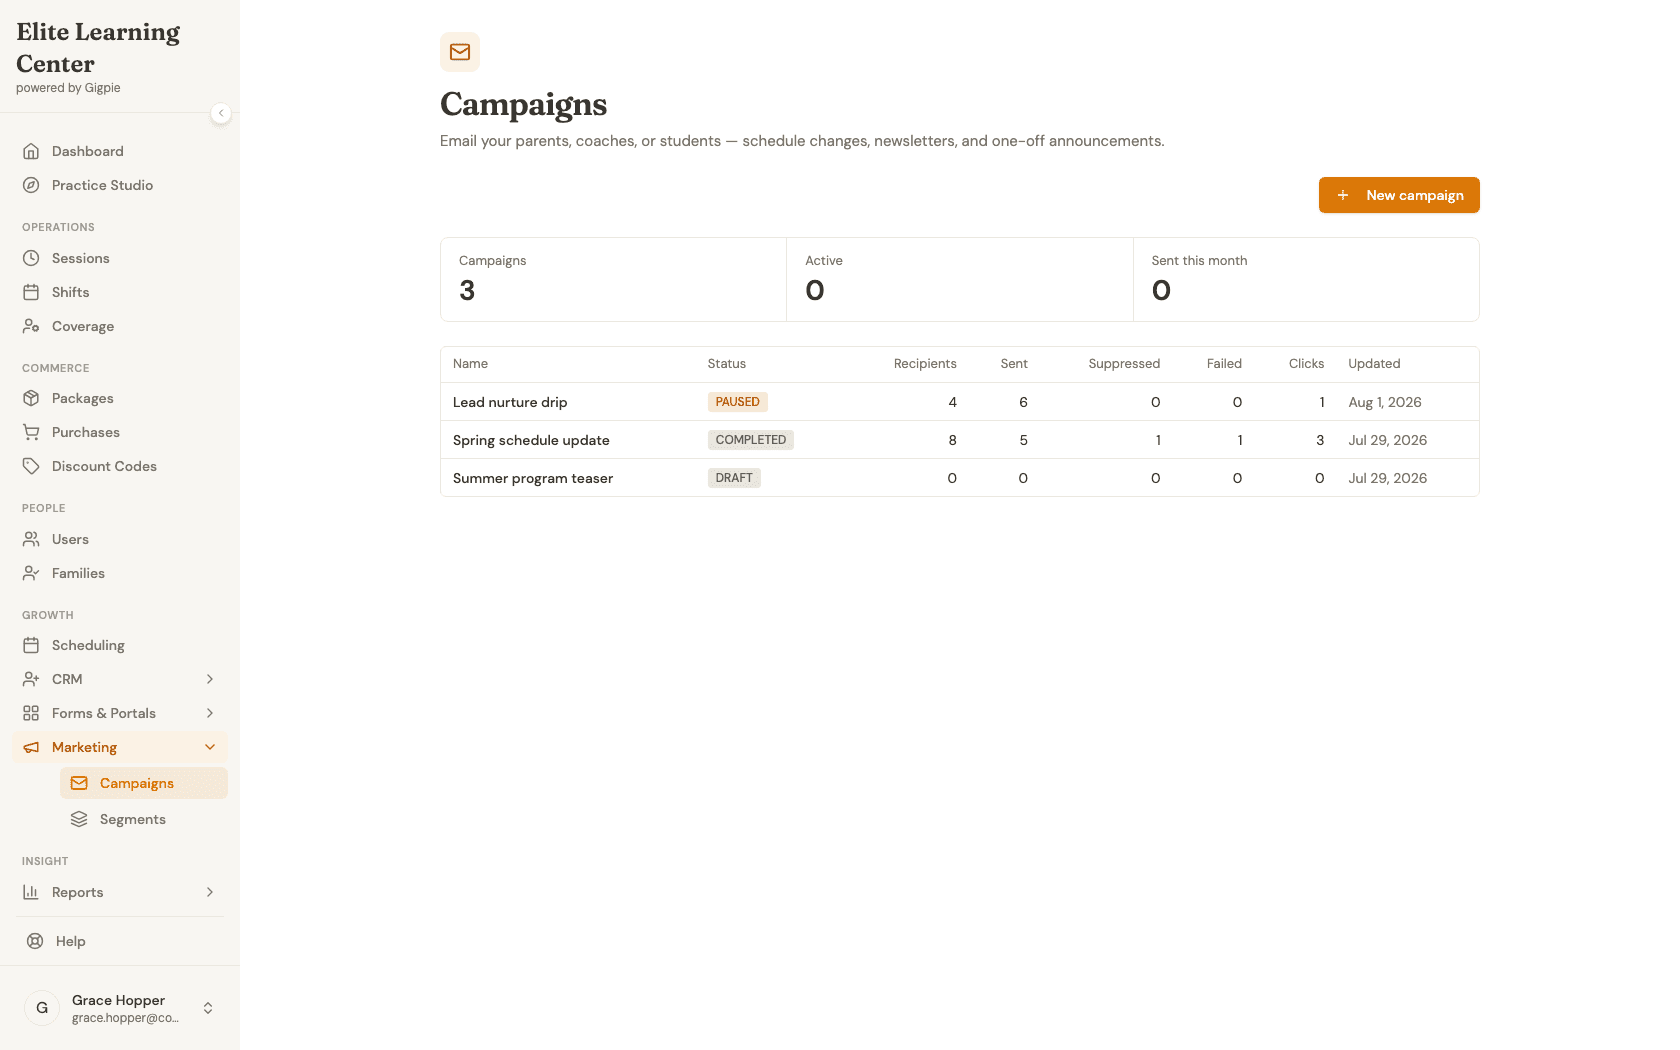
Open Campaigns
Expand Marketing in the sidebar, then click Campaigns.
- 3
Open the Lead nurture drip journey
Click the journey to open its flow graph — entry, the intro send, the wait-until-clicked step, and the branch into engaged vs. nudge paths.
- 4
Inspect the “Wait until” node
Click the Wait until node to see exactly what it's waiting for and how long before it gives up.
- 5
Preview the intro email
Click the intro Send email node to see its actual rendered content — subject, body, and footer, exactly as contacts received it.
- 6
Review delivery stats and recipients
Close the dialog and scroll down to see recipient, sent, and click counts, plus the per-send outcome for every contact who has passed through this journey.
What you'll accomplish
- You can read a journey's flow graph — entry, sends, waits, and branches — end to end.
- You know how to open any node to see its exact configuration or email content.
- You can check a journey's delivery stats and see which node each contact is currently on (or ended on).
Related Guides
- How to work leads in the CRM pipeline - Where the leads a journey nurtures come from
- CRM & Marketing Automation - How pipelines, the inbox, and journeys work together